
Virtual collaboration and communication are evolving, and so is the need to truly understand how your digital spaces are being used. That’s why SpatialChat is excited to introduce the brand-new Analytics Dashboard, designed to help you track engagement, measure impact, and make every virtual experience count.
Whether you’re running a virtual event, facilitating a webinar, managing a remote team in a virtual office, or hosting interactive online learning sessions, the Analytics Dashboard puts real-time insight at your fingertips, so you can make smarter, faster decisions.
Introducing the All-New Analytics Dashboard in SpatialChat
Virtual collaboration is evolving, and so is the need to understand how your digital spaces are being used. That’s why SpatialChat is introducing the new Analytics Dashboard, designed to help you track engagement and measure impact.
Whether you’re running a virtual event, facilitating a webinar, managing a remote team, or hosting online learning sessions, the Analytics Dashboard gives you real-time insights to make better decisions.
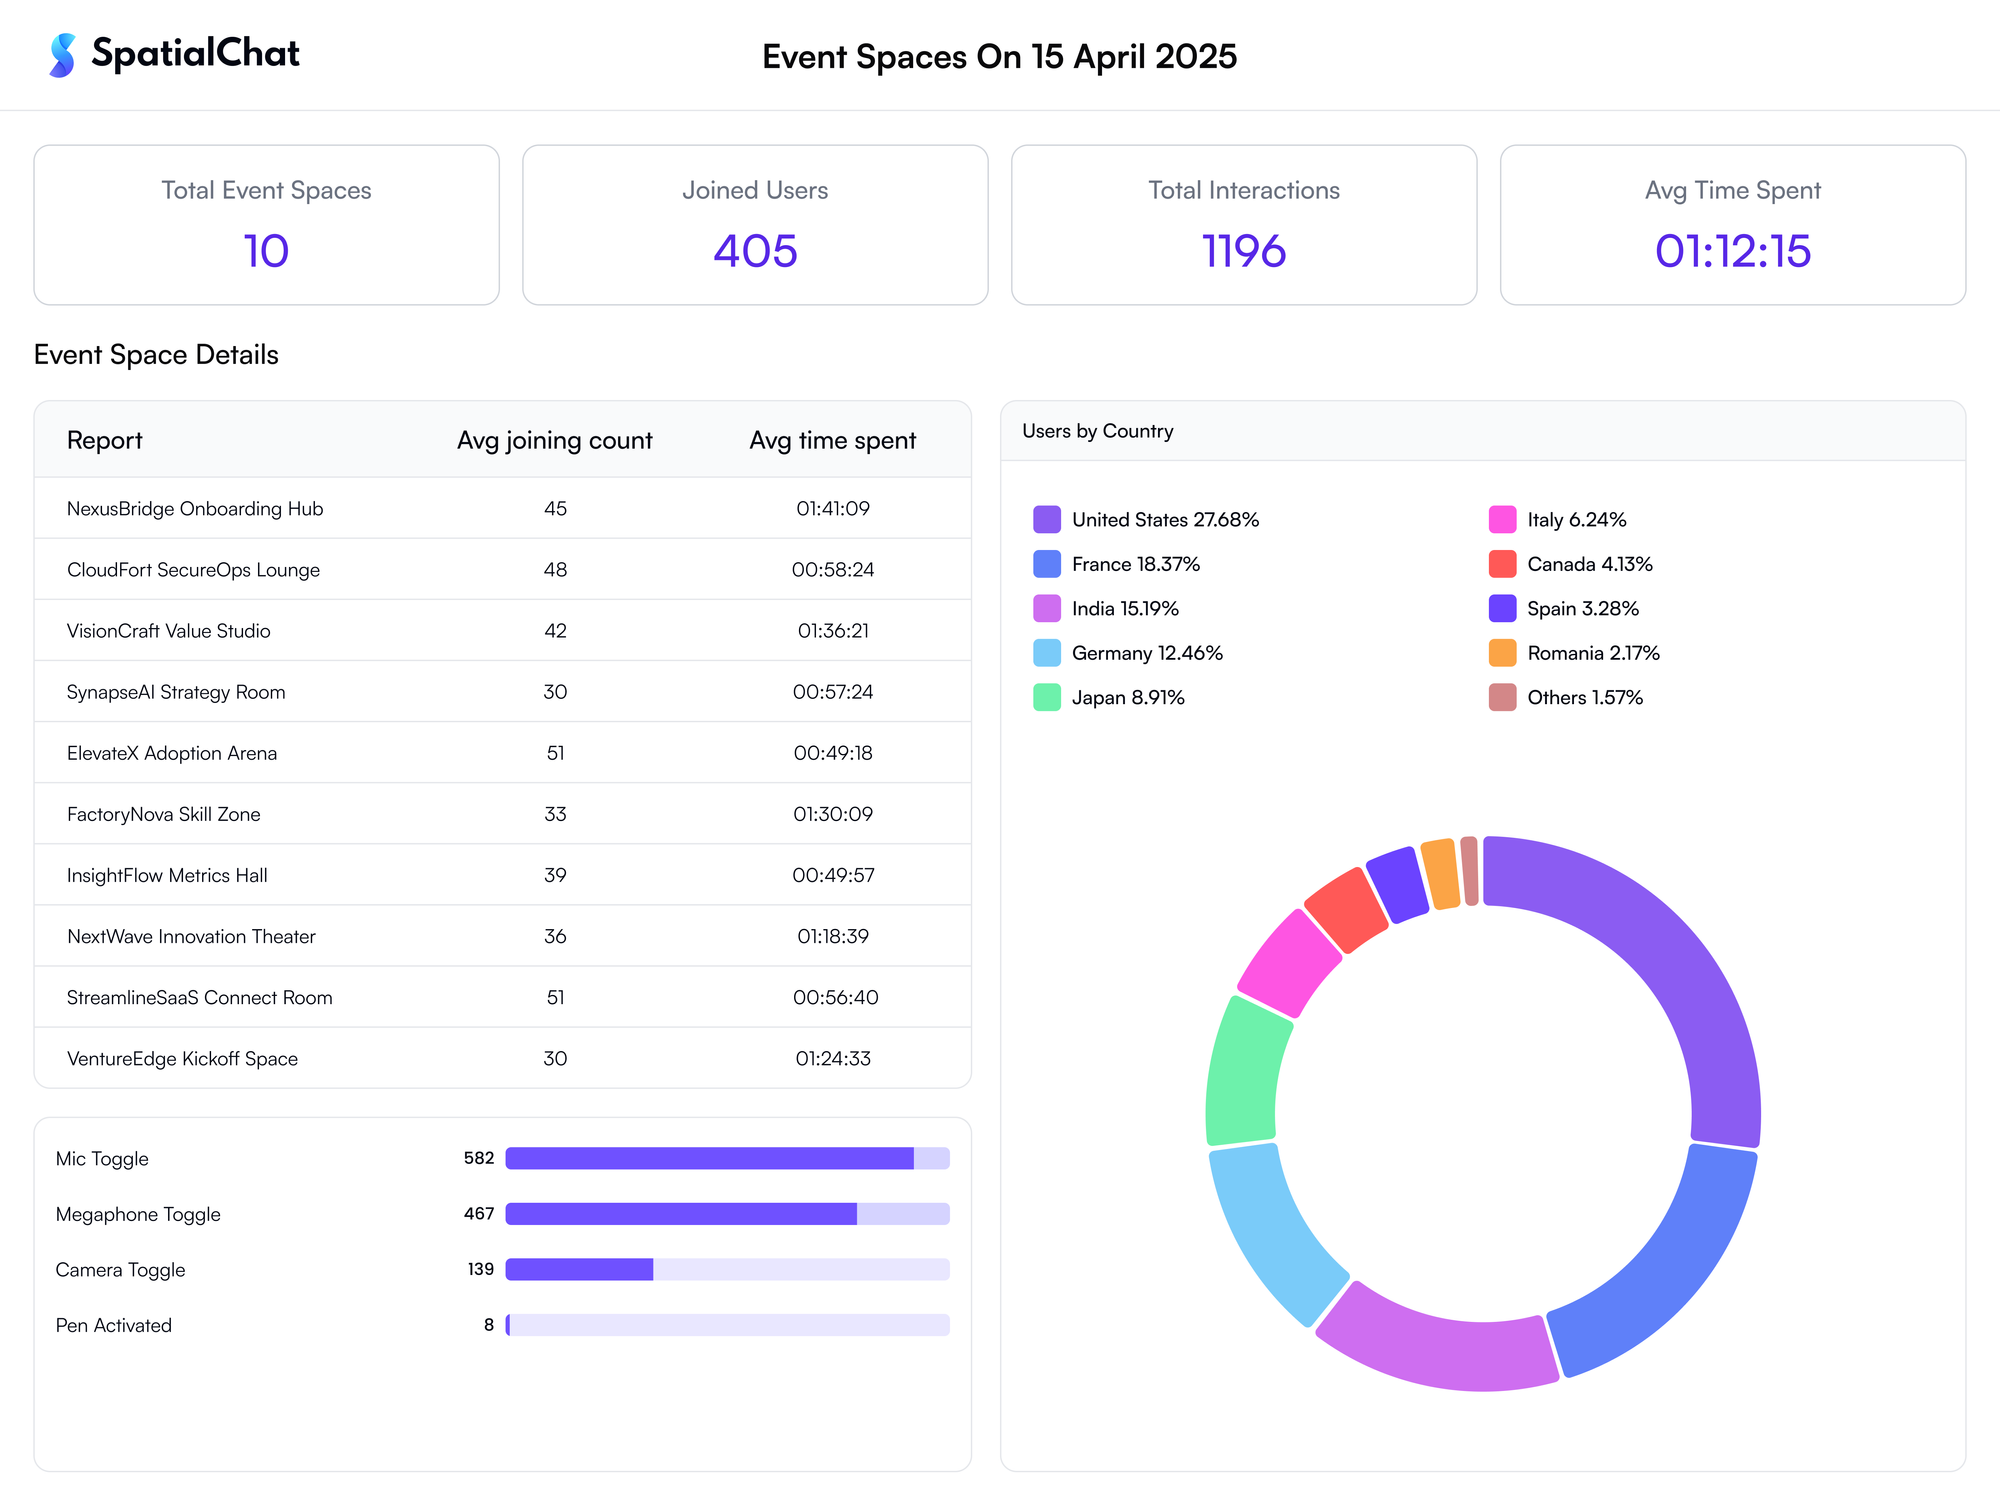
Your Central Hub for Insights
Whether you're running a virtual summit, hosting an internal all-hands, or managing a remote team session, the Analytics Dashboard gives you complete visibility into attendee behavior and room performance.
From participation trends to room activity, the Analytics Dashboard gives you a full view of how people engage within your SpatialChat environment. It's built for flexibility across all use cases, whether you're hosting live events, supporting remote teams, teaching online, or delivering content-rich webinars.
Here’s a breakdown of what you can track:
Core Metrics
✔️ Total Active Spaces – Monitor how many rooms are live and being used.
✔️ Joined Users – Get a clear count of all participants entering your space.
✔️ Event Toggles – See how often users switch between rooms, features, or experiences.
✔️ Average Time Spent – Measure how long attendees or users stay, per session.
✔️ Average Joining Count – Understand how many times users revisit your space.
✔️ Geography Distribution – View where your participants are joining from across the globe.
Engagement & Interaction Stats
🔹 Mic Toggle – Gauge participation across meetings, classes, or events by tracking who’s unmuting to speak.
🔹 Camera Toggle – Track video usage to see who’s showing up on screen.
🔹 Chat Messages Sent – Monitor how much conversation is happening across your rooms.
🔹 Element Shared – See what content (docs, images, videos) is being shared by users.
🔹 Invite CTA Clicked – Measure how effectively users are bringing others into your space.
🔹 Update Room – Track room customizations or layout changes during a session.
🔹 Google Calendar Room Selected – Monitor how often rooms are accessed via calendar links.
🔹 Connection Errors – Stay ahead of tech hiccups by spotting patterns and troubleshooting issues quickly.
Why You’ll Want to Use This Right Away
The Analytics Dashboard isn’t just about collecting numbers—it’s about understanding the behavior, engagement, and flow across your virtual spaces. No matter your use case, these insights help you:
- Identify high-engagement sessions, rooms, or teaching moments and replicate their success
- See which rooms or features are underutilized, and why
- Spot disengagement early and course-correct in real time
- Back your decisions with presentation-ready data and visual reports
Start Tracking Smarter, Today
The Analytics Dashboard is now live and available in your team space. Just log in and click the Analytics tab to get started. You can also book a demo here to learn more about the new dashboard. We’d love to hear any feedback you have!
In a world where attention is fleeting, SpatialChat helps you keep it, and now, measure it. Welcome to the next generation of smarter, more connected virtual spaces.